Fig. 4
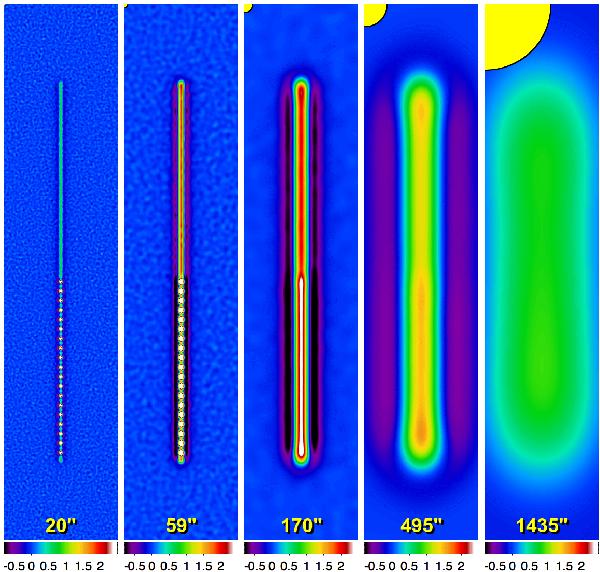
Spatial decomposition (Sect. 2.3). Single
scales ℐλDj of the simulated image
ℐλD (Fig. 3)
are shown for
j = 18,32,46,60,74,
NS = 99, fS = 1.079,
 ,
SNS = 9609″. The scales
Sj are separated by a factor of 3 to
illustrate the spatial decomposition; negative areas surrounding the filament are
the direct consequence of the subtraction in Eq. (2). Scale sizes Sj
are visualized and annotated here and in all subsequent similar figures.
,
SNS = 9609″. The scales
Sj are separated by a factor of 3 to
illustrate the spatial decomposition; negative areas surrounding the filament are
the direct consequence of the subtraction in Eq. (2). Scale sizes Sj
are visualized and annotated here and in all subsequent similar figures.


Current usage metrics show cumulative count of Article Views (full-text article views including HTML views, PDF and ePub downloads, according to the available data) and Abstracts Views on Vision4Press platform.
Data correspond to usage on the plateform after 2015. The current usage metrics is available 48-96 hours after online publication and is updated daily on week days.
Initial download of the metrics may take a while.