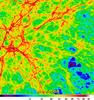
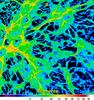
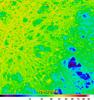
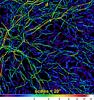
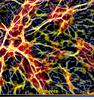
Fig. A.1

Filaments in the MareNostrum simulation of the formation of galaxies. The upper panels display the original image (a), extracted filaments on all spatial scales (b), and filament-subtracted image (c). The lower panels show the filaments partially reconstructed up to 20′′ scale (d), 3-color (red, green, blue) composite image of the filaments partially reconstructed up to 2000′′, 160′′, and 10′′ scales (e), as well as the segmentation image of skeletons that appear on more than 5 spatial scales (f). Pixel values in panel (f) represent the skeleton number.

Current usage metrics show cumulative count of Article Views (full-text article views including HTML views, PDF and ePub downloads, according to the available data) and Abstracts Views on Vision4Press platform.
Data correspond to usage on the plateform after 2015. The current usage metrics is available 48-96 hours after online publication and is updated daily on week days.
Initial download of the metrics may take a while.