Fig. 17
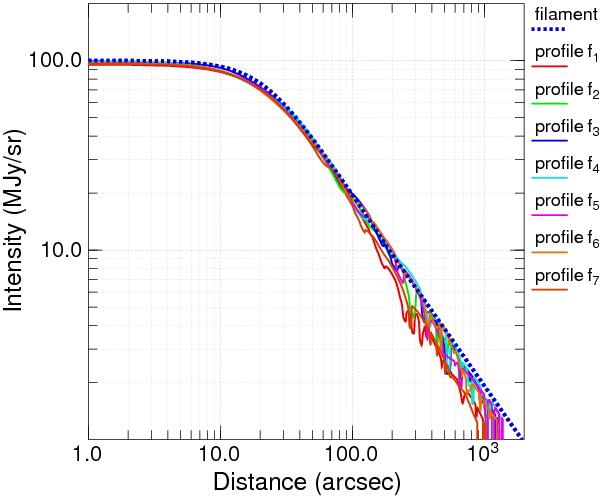
Profiles of the reconstructed filament for a simplified version of the simulated image (Figs. 2, 3) with only noise but without background and sources, obtained in the final extraction. Profiles f1 to f7 show cuts through the extracted filament (Fig. 16a) at 7 equidistant locations from its bottom to the top.
Current usage metrics show cumulative count of Article Views (full-text article views including HTML views, PDF and ePub downloads, according to the available data) and Abstracts Views on Vision4Press platform.
Data correspond to usage on the plateform after 2015. The current usage metrics is available 48-96 hours after online publication and is updated daily on week days.
Initial download of the metrics may take a while.