Fig. 15
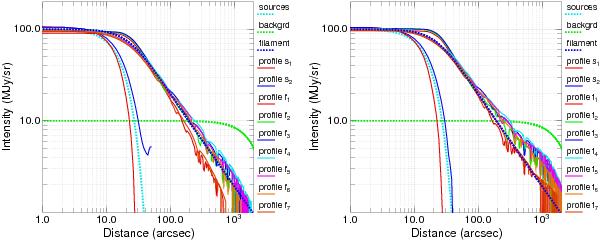
Profiles of the components of the simulated image (Figs. 2, 3) obtained in the initial and final extractions (left and right, respectively). Orthogonal profiles of a model source (the second one from the bottom in Fig. 14d) are labeled s1 and s2; the narrower one (red) cuts through the source in a direction perpendicular to the filament, whereas the wider one (blue) is the source profile along the filament. Profiles f1 to f7 show cuts through the reconstructed filament (Fig. 14a) at 7 equidistant locations from its bottom to the top. The first three profiles (f1–f3) pass through the locations of the 2nd, 8th, and 14th sources; all other profiles (f4–f7) display the upper half of the filament, unaffected by sources.
Current usage metrics show cumulative count of Article Views (full-text article views including HTML views, PDF and ePub downloads, according to the available data) and Abstracts Views on Vision4Press platform.
Data correspond to usage on the plateform after 2015. The current usage metrics is available 48-96 hours after online publication and is updated daily on week days.
Initial download of the metrics may take a while.