Fig. 11
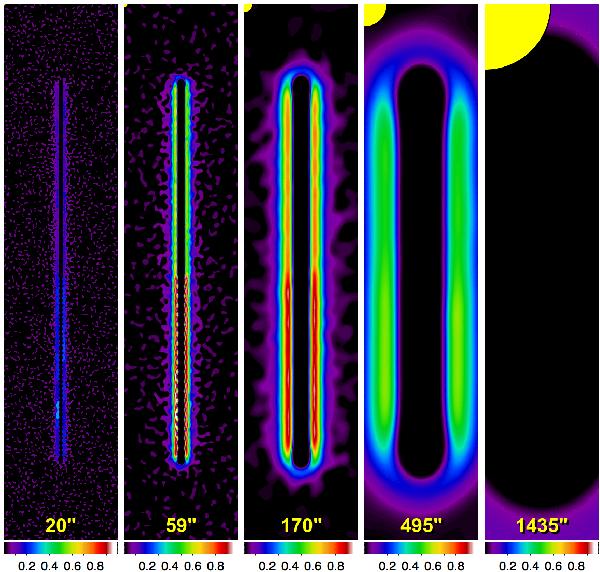
Reconstructed negative areas in single-scale images of filaments (Sect. 2.4). The images of spatial scales from Fig.
4 are shown here in pixels with
 after the removal of small clusters with large negative values around bright
non-filamentary peaks (sources) within the filament (cf. Figs. 4, 6). The
images are shown here with positive values (multiplied by − 1) for better
visibility.
after the removal of small clusters with large negative values around bright
non-filamentary peaks (sources) within the filament (cf. Figs. 4, 6). The
images are shown here with positive values (multiplied by − 1) for better
visibility.


Current usage metrics show cumulative count of Article Views (full-text article views including HTML views, PDF and ePub downloads, according to the available data) and Abstracts Views on Vision4Press platform.
Data correspond to usage on the plateform after 2015. The current usage metrics is available 48-96 hours after online publication and is updated daily on week days.
Initial download of the metrics may take a while.