Fig. 6
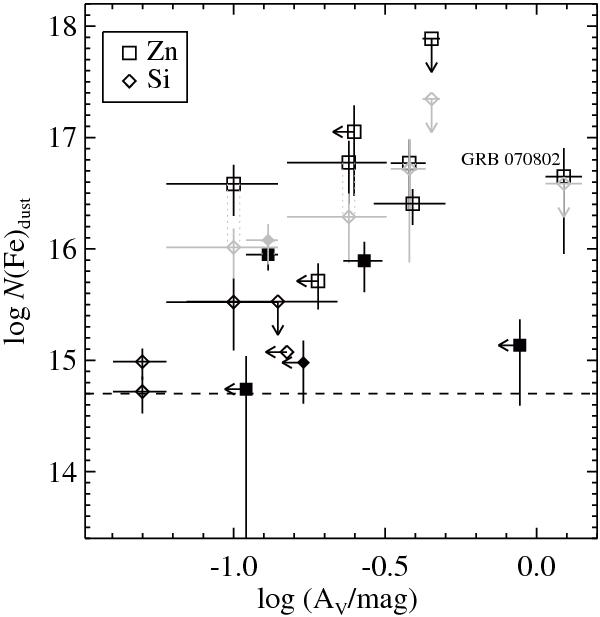
Optical extinction AV distribution with the column density of Fe in dust. The dashed line marks the column density above which a significant presence of molecules has been observed in QSO-DLAs (Noterdaeme et al. 2008). When both are available, the measurements derived from Zn and Si are displayed in black and grey, respectively. The symbols are the same as in Fig. 4.
Current usage metrics show cumulative count of Article Views (full-text article views including HTML views, PDF and ePub downloads, according to the available data) and Abstracts Views on Vision4Press platform.
Data correspond to usage on the plateform after 2015. The current usage metrics is available 48-96 hours after online publication and is updated daily on week days.
Initial download of the metrics may take a while.