Fig. 5
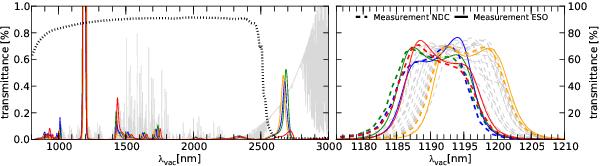
Filter curves for the 4 spare filters. These filters are relevant since they are the only ones that have two sets of measurements available: by NDC over 1100 − 1300 nm (dashed lines) and by ESO over 800 − 3000 nm (solid lines). Each colour represents one of the four filters. The left panel shows the full wavelength range covered by our measurements from the ESO laboratory. The grey line is a sky emission spectrum (see text), and the dotted line represents detector QE and mirror reflectivity (see text), but not atmospheric absorption. The right panel shows a zoom near the passband of the filters; here both NDC and ESO measurements are available. The 16 grey curves in the background show the 16 filters installed in VIRCAM (these are the filter curves shown in the top row of Fig. 4). All curves have been transformed from air to vacuum, but no further transformations have been applied.
Current usage metrics show cumulative count of Article Views (full-text article views including HTML views, PDF and ePub downloads, according to the available data) and Abstracts Views on Vision4Press platform.
Data correspond to usage on the plateform after 2015. The current usage metrics is available 48-96 hours after online publication and is updated daily on week days.
Initial download of the metrics may take a while.