Fig. 13
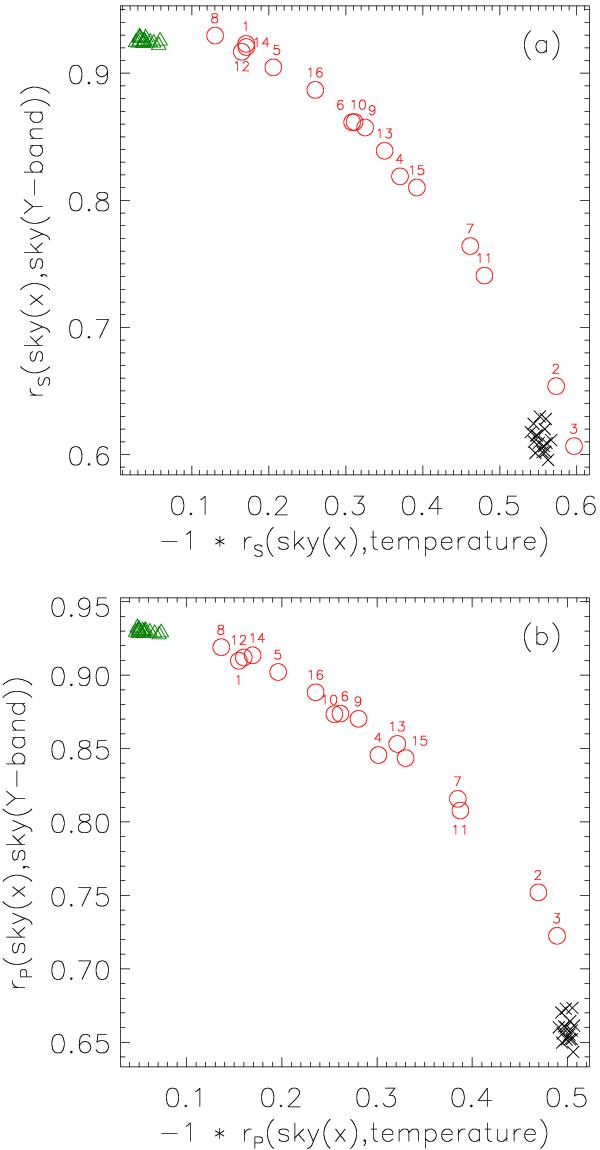
Sky brightness correlation coefficients for the 16 detectors. Green triangles: J, red circles: NB118, black crosses: Ks. The x-axes show the correlation coefficient with the ambient temperature, while the y-axis shows the correlation coefficient with the sky brightness in the Y band in the given detector. The correlation coefficients on the x-axes have been multiplied by minus one, since they would otherwise be negative due to the the sky brightness being in mag/arcsec2. Panel a) shows the Spearman rank order correlation coefficient rS while panel b) shows the linear Pearson correlation coefficient rP. The individual NB118 points are labelled with the detector number.
Current usage metrics show cumulative count of Article Views (full-text article views including HTML views, PDF and ePub downloads, according to the available data) and Abstracts Views on Vision4Press platform.
Data correspond to usage on the plateform after 2015. The current usage metrics is available 48-96 hours after online publication and is updated daily on week days.
Initial download of the metrics may take a while.