Fig. 10
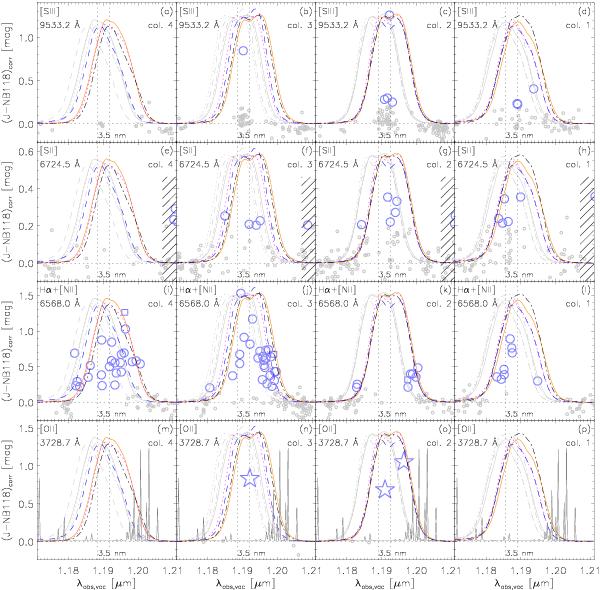
Wavelength response of the 16 NB118 filters, as illustrated by objects with spectroscopic redshifts. These plots are as Fig. 9, except that λobs,vac = (1 + z)λrest,vac rather than z is on the x-axis. The 4 rows of the figure correspond to 4 emission lines or emission line blends, with the used rest-frame vacuum wavelength listed. The 4 columns of the figure correspond to the 4 columns of the stack (see Fig. 2), where each column contains data from 4 NB118 filters (namely filters 1 − 4, 5 − 8, 9 − 12 and 13 − 16 for Cols. 1 − 4, respectively), and where the corresponding filter curves are overplotted. The grey filter curves are those from the bottom row of Fig. 4, while the coloured ones are the curves shifted by 3.5 nm to the red to visually match the data. The vertical dotted lines indicate the centre wavelength of the 4 filters in the given panel before and after the shift. In the [S ii] panels (panels e) − h)) the hatched region indicates a redshift range where narrow-band excess is likely due to Hα rather than [S ii]. In the bottom row the theoretical sky spectrum used in Sect. 4 is shown, scaled to fit the panel.
Current usage metrics show cumulative count of Article Views (full-text article views including HTML views, PDF and ePub downloads, according to the available data) and Abstracts Views on Vision4Press platform.
Data correspond to usage on the plateform after 2015. The current usage metrics is available 48-96 hours after online publication and is updated daily on week days.
Initial download of the metrics may take a while.