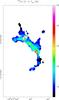
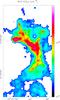
Fig. 8
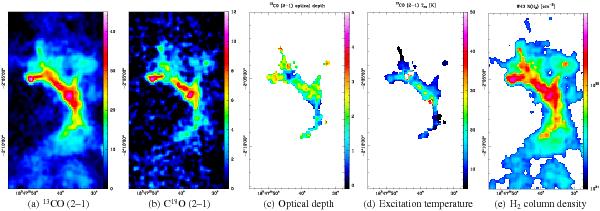
Series of plots showing the different steps of calculations carried out for each source. The example shows source 29, which is located in the center of the W43 complex at a velocity of 115 km s-1. From left to right: a) 13CO (2–1) in [K km s-1]; b) C18O (2–1) in [K km s-1]; c) optical depth τ of 13CO (2–1); d) excitation temperature in [K]; and e) H2 column density map in [cm-2] derived from the CO lines as described in Sect. 4.1.3. The column density has been calculated from an assumed constant excitation temperature.
Current usage metrics show cumulative count of Article Views (full-text article views including HTML views, PDF and ePub downloads, according to the available data) and Abstracts Views on Vision4Press platform.
Data correspond to usage on the plateform after 2015. The current usage metrics is available 48-96 hours after online publication and is updated daily on week days.
Initial download of the metrics may take a while.