Free Access
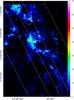
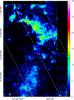
Fig. 6
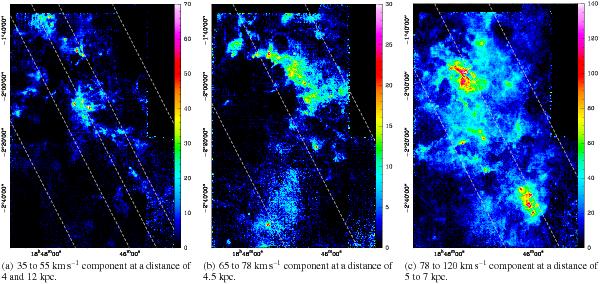
Integrated 13CO (2–1) maps of the separated velocity complexes. The white stripes mark the Galactic plane and the planes 30 pc above and below it. Panel a) shows sources at two different distances and therefore two different scales.
This figure is made of several images, please see below:
Current usage metrics show cumulative count of Article Views (full-text article views including HTML views, PDF and ePub downloads, according to the available data) and Abstracts Views on Vision4Press platform.
Data correspond to usage on the plateform after 2015. The current usage metrics is available 48-96 hours after online publication and is updated daily on week days.
Initial download of the metrics may take a while.