Free Access
Fig. 4
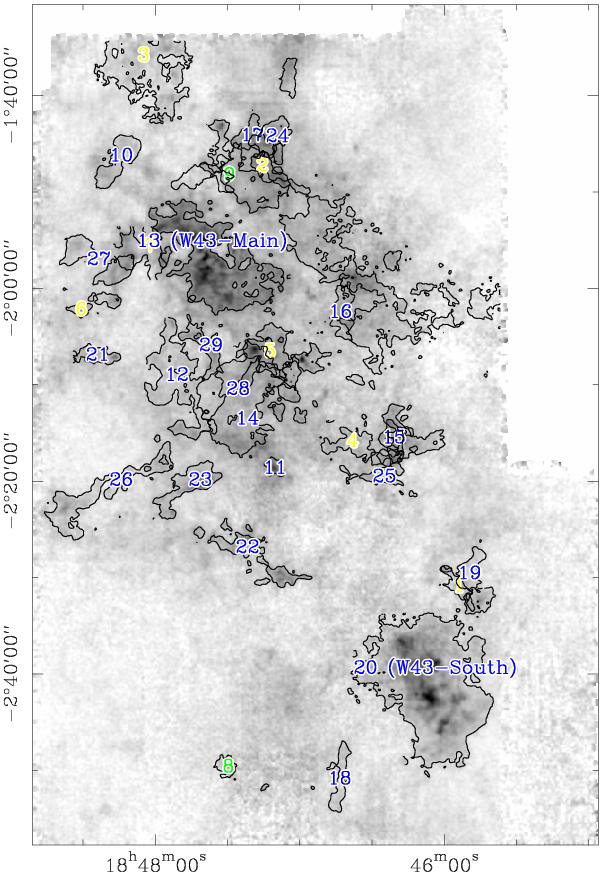
Detection map of the Duchamp Sourcefinder. Detected clouds are overlaid on a gray-scale map of 13CO (2–1). Sources are ordered by their peak velocities. The color-coding relates to the distance of identified clouds: blue for 6 kpc, green for 4.5 kpc, and yellow for the 4 and 12 kpc component.
Current usage metrics show cumulative count of Article Views (full-text article views including HTML views, PDF and ePub downloads, according to the available data) and Abstracts Views on Vision4Press platform.
Data correspond to usage on the plateform after 2015. The current usage metrics is available 48-96 hours after online publication and is updated daily on week days.
Initial download of the metrics may take a while.