Free Access
Fig. 3
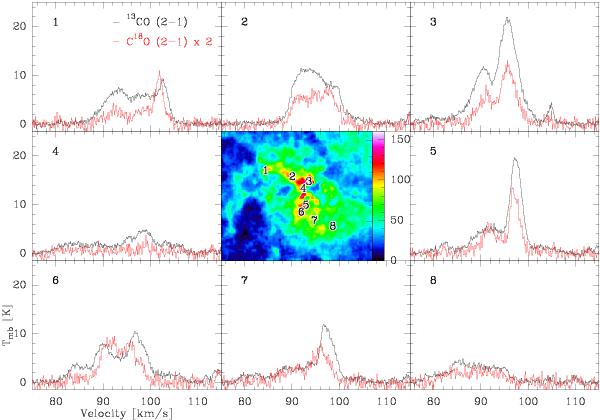
13CO (2–1) and C18O (2–1) spectra of several points in W43-Main. The central map is a 13CO intensity map integrated over the velocity range of 78 to 110 km s-1 in units of K km s-1.
Current usage metrics show cumulative count of Article Views (full-text article views including HTML views, PDF and ePub downloads, according to the available data) and Abstracts Views on Vision4Press platform.
Data correspond to usage on the plateform after 2015. The current usage metrics is available 48-96 hours after online publication and is updated daily on week days.
Initial download of the metrics may take a while.