Fig. 13
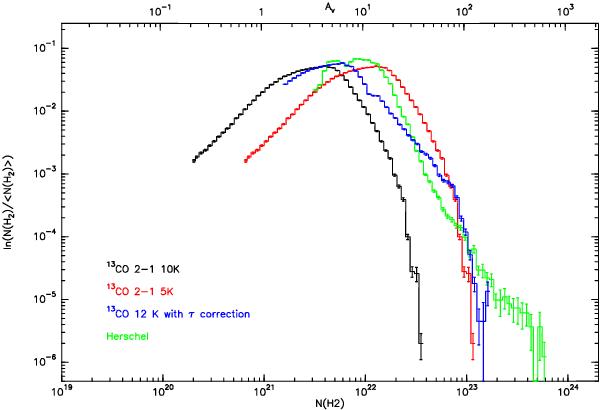
Probability distribution functions of the H2 column density derived for the whole W43 complex from different data sets and methods. The y-axis is normalized to the mean value of N(H2). Isothermal CO column densities (5 and 10 K) are plotted in red and black; CO derived values with optical depth correction are in blue, and Herschel results are in green.
Current usage metrics show cumulative count of Article Views (full-text article views including HTML views, PDF and ePub downloads, according to the available data) and Abstracts Views on Vision4Press platform.
Data correspond to usage on the plateform after 2015. The current usage metrics is available 48-96 hours after online publication and is updated daily on week days.
Initial download of the metrics may take a while.