Fig. 1
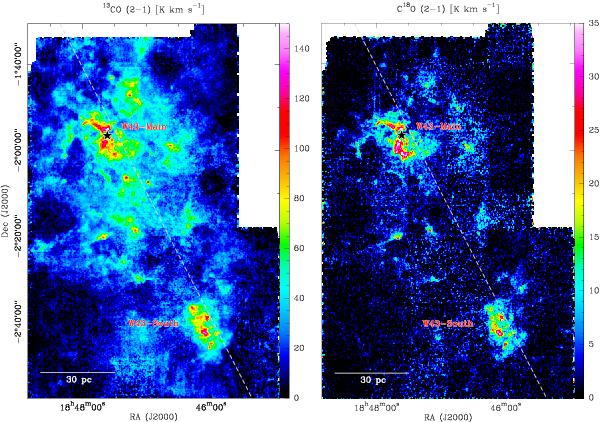
Integrated intensity maps created from the resulting data cubes of the complete W43 field in units of K km s-1. The complete spectral range of 30–130 km s-1 has been used to create these maps. The dashed lines denote the Galactic plane, while the star in W43-Main marks the OB star cluster. The left plot shows 13CO (2–1), while the right side plots the C18O (2–1) map.
Current usage metrics show cumulative count of Article Views (full-text article views including HTML views, PDF and ePub downloads, according to the available data) and Abstracts Views on Vision4Press platform.
Data correspond to usage on the plateform after 2015. The current usage metrics is available 48-96 hours after online publication and is updated daily on week days.
Initial download of the metrics may take a while.