Fig. 8
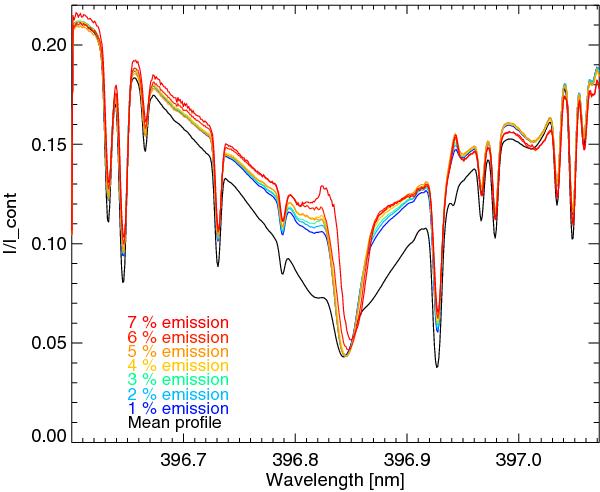
Mean profiles of those that contain Fe II emissions for different emission strengths. The curves are cumulative, so that the 6% curve contains the 7% curve, etc. The average line profile for the data sequence is plotted for comparison. The intensity scale is normalized to the continuum, based on a comparison of our average line profile with an FTS atlas profile.
Current usage metrics show cumulative count of Article Views (full-text article views including HTML views, PDF and ePub downloads, according to the available data) and Abstracts Views on Vision4Press platform.
Data correspond to usage on the plateform after 2015. The current usage metrics is available 48-96 hours after online publication and is updated daily on week days.
Initial download of the metrics may take a while.