Free Access
Fig. 7
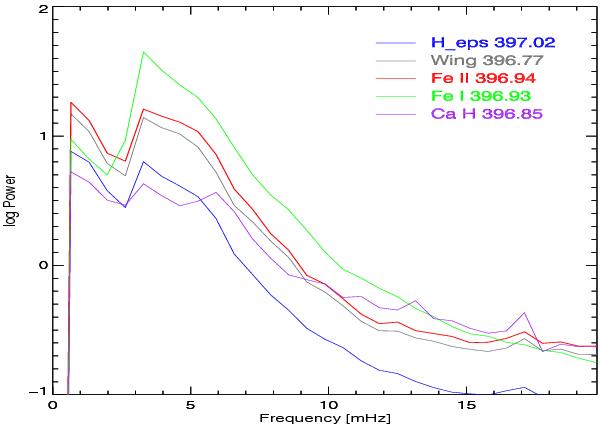
Temporal power spectra of intensity fluctuations measured at the monochromatic wavelengths listed in Fig. 5, averaged along the spectrograph slit and the spatial scan coordinate. The power spectrum measured in the core of the Hϵ line is also shown.
Current usage metrics show cumulative count of Article Views (full-text article views including HTML views, PDF and ePub downloads, according to the available data) and Abstracts Views on Vision4Press platform.
Data correspond to usage on the plateform after 2015. The current usage metrics is available 48-96 hours after online publication and is updated daily on week days.
Initial download of the metrics may take a while.