Free Access
Fig. 5
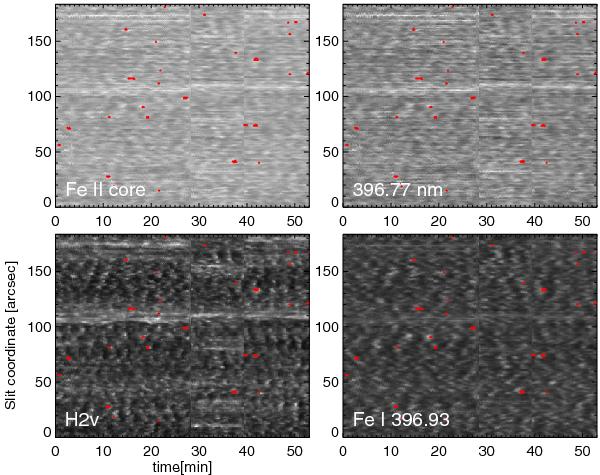
Monochromatic space-time maps at fixed slit position for the Fe II line core, the blue wing of the Ca II H line, the Fe I line core at 396.93 nm, and the H2v emission peak. The location of Fe II emission events is indicated by red contours.
Current usage metrics show cumulative count of Article Views (full-text article views including HTML views, PDF and ePub downloads, according to the available data) and Abstracts Views on Vision4Press platform.
Data correspond to usage on the plateform after 2015. The current usage metrics is available 48-96 hours after online publication and is updated daily on week days.
Initial download of the metrics may take a while.