Fig. 4
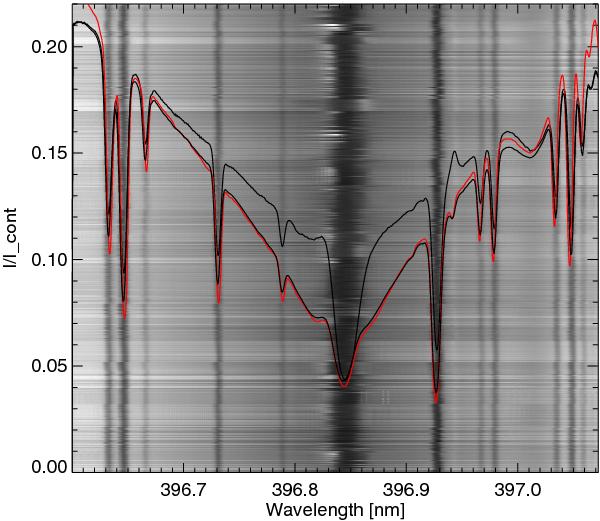
Collage of several hundred line profiles showing an Fe II emission at 396.94 nm. The lower black line shows the mean line profile averaged along the slit and over the 3200 s sequence. The upper black line is the mean line profile of the emission events shown in this figure and shows a large increase in the inner Ca II H line wing intensity at the Fe II emission locations. An FTS atlas profile is shown as red line for comparison. We note the more or less complete absence of H 2r emissions at the emission events.
Current usage metrics show cumulative count of Article Views (full-text article views including HTML views, PDF and ePub downloads, according to the available data) and Abstracts Views on Vision4Press platform.
Data correspond to usage on the plateform after 2015. The current usage metrics is available 48-96 hours after online publication and is updated daily on week days.
Initial download of the metrics may take a while.