Fig. 3
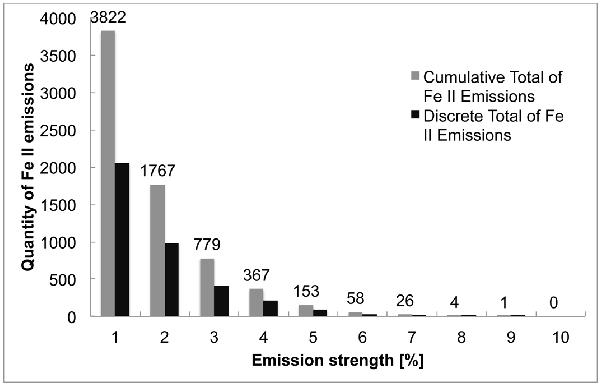
Quantity of Fe II emission features identified in the data sequence. The horizontal axis denotes the emission strength (see text), and the vertical axis, as well as the labels above the bars indicate the number of events. The black bars are discrete and show the number of emission events with just the indicated strength; the grey bars are cumulative and show the number of events with emission strength equal to or greater than the value specified at each bar.
Current usage metrics show cumulative count of Article Views (full-text article views including HTML views, PDF and ePub downloads, according to the available data) and Abstracts Views on Vision4Press platform.
Data correspond to usage on the plateform after 2015. The current usage metrics is available 48-96 hours after online publication and is updated daily on week days.
Initial download of the metrics may take a while.