Free Access
Fig. 18
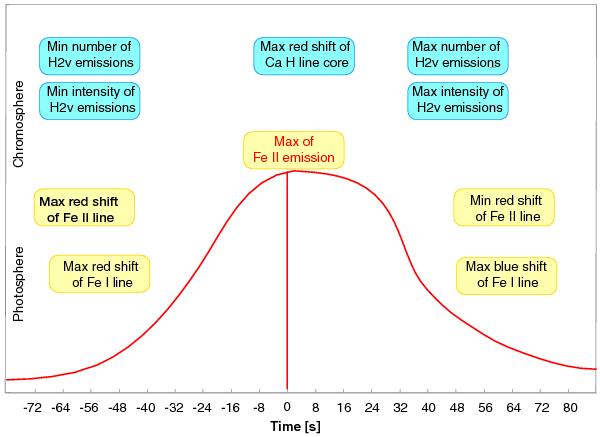
Sketch of the temporal behavior of wavelength shifts and intensity changes of several lines in the wings of Ca II H before and after Fe II emissions. The red line is the envelope of the Fe II emission behavior depicted in the top panel of Fig. 13.
Current usage metrics show cumulative count of Article Views (full-text article views including HTML views, PDF and ePub downloads, according to the available data) and Abstracts Views on Vision4Press platform.
Data correspond to usage on the plateform after 2015. The current usage metrics is available 48-96 hours after online publication and is updated daily on week days.
Initial download of the metrics may take a while.