Free Access
Fig. 17
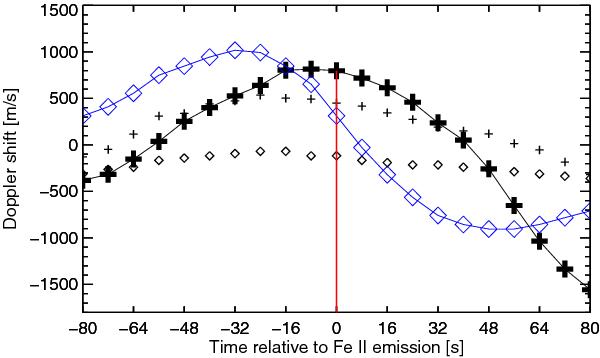
Change of line position of the Ca II H line core (heavy black symbols) and the Fe I line at 396.93 nm (blue diamonds) before and after a 3% Fe II emission at t = 0. The graph shows ten time steps before and after the emission event (vertical red line). The small symbols show the line positions of a control group.
Current usage metrics show cumulative count of Article Views (full-text article views including HTML views, PDF and ePub downloads, according to the available data) and Abstracts Views on Vision4Press platform.
Data correspond to usage on the plateform after 2015. The current usage metrics is available 48-96 hours after online publication and is updated daily on week days.
Initial download of the metrics may take a while.