Fig. 16
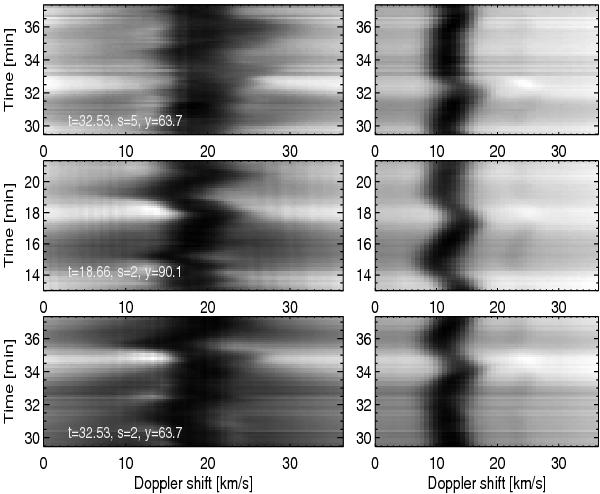
Spectral time slices of three indivdual emission events. Left panels: Ca II H line core; right panels: Fe I 396.93 nm line and Fe II line. The horizontal axis is scaled in Doppler velocity. The inserted text provides the time of the maximum Fe II emission, (in min, counted from the beginning of the sequence), the corresponding scan step, and the slit position (in arcsec). The two bottom rows show the same emission events as Fig. 6.
Current usage metrics show cumulative count of Article Views (full-text article views including HTML views, PDF and ePub downloads, according to the available data) and Abstracts Views on Vision4Press platform.
Data correspond to usage on the plateform after 2015. The current usage metrics is available 48-96 hours after online publication and is updated daily on week days.
Initial download of the metrics may take a while.