Fig. 15
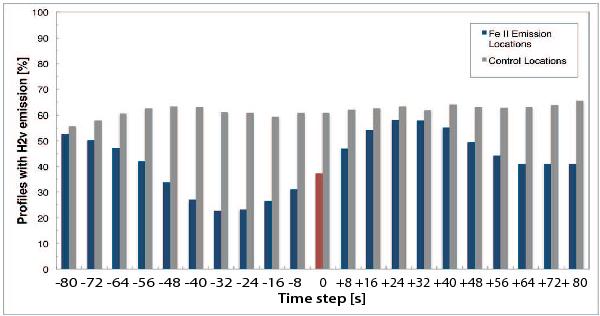
Temporal relation between Fe II emission events and Ca H 2v emissions. The Fe II emission occurs at time step 0. There is a clear decrease of Ca H 2v emissions before and a significant increase after a Fe II emission event. The graph shows the average behavior of all 779 Fe II emissions. The grey bars show for comparison the time line of H 2v emissions of an equal-sized control group that is not co-spatial with Fe II emissions.
Current usage metrics show cumulative count of Article Views (full-text article views including HTML views, PDF and ePub downloads, according to the available data) and Abstracts Views on Vision4Press platform.
Data correspond to usage on the plateform after 2015. The current usage metrics is available 48-96 hours after online publication and is updated daily on week days.
Initial download of the metrics may take a while.