Fig. 14
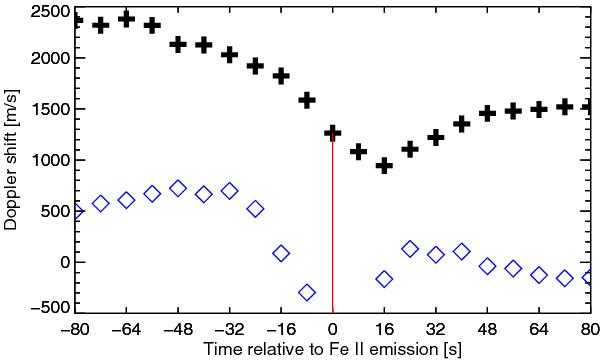
Change of line position of emissions and absorptions, converted to Doppler shifts, of the Fe II line before and after a 3% emission at t = 0. The graph shows ten time steps (±80 s) before and after the emission event (indicated by a vertical red line). The mean positions for all 799 emission events are displayed. The plus signs correspond to the emission profiles and the line positions of the absorptions are shown as blue diamonds. At t = 0 s and 8 s, there are no absorption profiles from which line positions could be derived.
Current usage metrics show cumulative count of Article Views (full-text article views including HTML views, PDF and ePub downloads, according to the available data) and Abstracts Views on Vision4Press platform.
Data correspond to usage on the plateform after 2015. The current usage metrics is available 48-96 hours after online publication and is updated daily on week days.
Initial download of the metrics may take a while.