Fig. 13
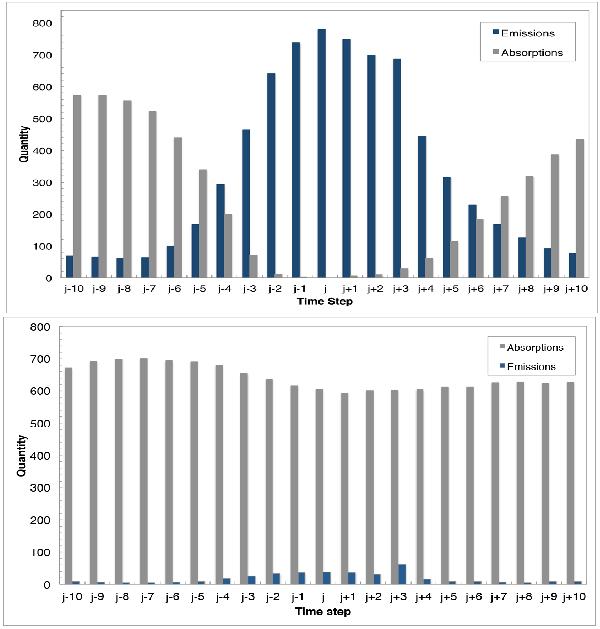
Top: change of the Fe II line from emission to absorption (and vice versa) in an interval of ±80 s before and after a 3% emission event of the Fe II line at time step j. The intensity thresholds for emission and absorption are 1.5% above or below the local continuum. The vertical axis denotes the number of emission or absorption features found at each time step. Bottom: the same relation, but for a set of arbitrarily chosen control locations.
Current usage metrics show cumulative count of Article Views (full-text article views including HTML views, PDF and ePub downloads, according to the available data) and Abstracts Views on Vision4Press platform.
Data correspond to usage on the plateform after 2015. The current usage metrics is available 48-96 hours after online publication and is updated daily on week days.
Initial download of the metrics may take a while.