Free Access
Fig. 12
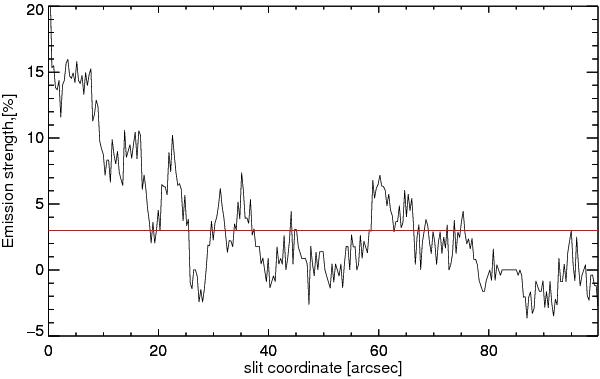
Emission strength of the Fe II line observed at the solar limb. The horizontal axis gives the distance from the limb, the vertical axis is the emission strength as defined in Sect. 2.1. Negative values correspond to absorption. The horizontal line indicates the 3% threshold used in this paper.
Current usage metrics show cumulative count of Article Views (full-text article views including HTML views, PDF and ePub downloads, according to the available data) and Abstracts Views on Vision4Press platform.
Data correspond to usage on the plateform after 2015. The current usage metrics is available 48-96 hours after online publication and is updated daily on week days.
Initial download of the metrics may take a while.