Free Access
Fig. 10
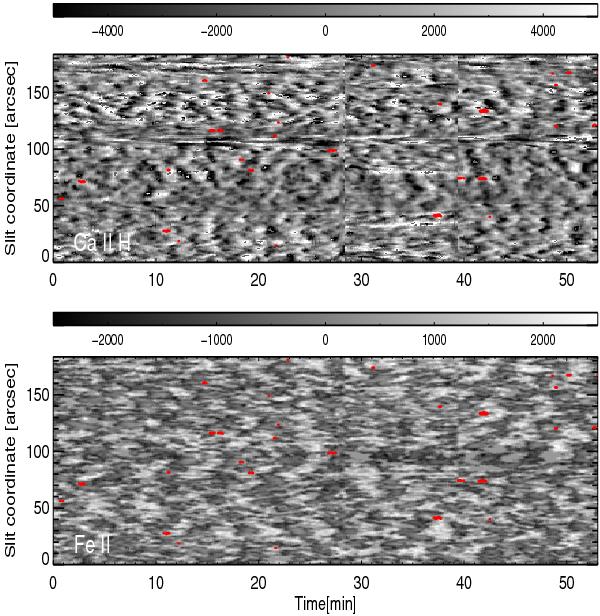
Doppler velocity as a function of time for a fixed slit position. Fe II emission events are overplotted as red contour lines. Top panel: Ca II H line core velocity, bottom panel: Fe II velocity. The color bars above the panels indicate the velocity range in ms-1.
Current usage metrics show cumulative count of Article Views (full-text article views including HTML views, PDF and ePub downloads, according to the available data) and Abstracts Views on Vision4Press platform.
Data correspond to usage on the plateform after 2015. The current usage metrics is available 48-96 hours after online publication and is updated daily on week days.
Initial download of the metrics may take a while.