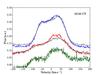
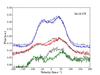
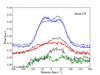
Fig. 9
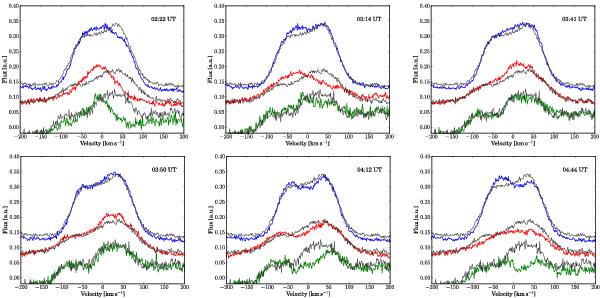
Spectra of Hα (red), Hβ (green), and Ca ii K (blue) with a PHOENIX spectrum subtracted and scaled for convenience. For comparison the PHOENIX-subtracted flare spectrum (2:58 UT) of each line is over-plotted in black. Different behaviour is seen for the lines, e. g. at 3:14 UT, where the Ca ii line is still double peaked, while in Hα and Hβ the peak at 40 km s-1 has already decayed. Also, the rotationally induced shift of line components is seen, e. g. in Hα the main component, which moves from about –40 (3:14 UT) to +20 (3:41 UT), +30 (3:50 UT), and finally to +50 km s-1 (4:12 UT).
Current usage metrics show cumulative count of Article Views (full-text article views including HTML views, PDF and ePub downloads, according to the available data) and Abstracts Views on Vision4Press platform.
Data correspond to usage on the plateform after 2015. The current usage metrics is available 48-96 hours after online publication and is updated daily on week days.
Initial download of the metrics may take a while.