Fig. 8
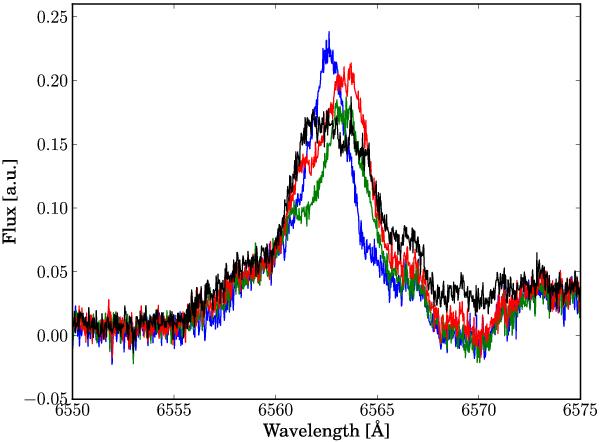
Examples from the evolution of the Hα line after subtracting a PHOENIX spectrum in the first hour of observations, covering the main flare. Blue: spectrum at 2:13 UT (first spectrum taken), green: spectrum at 2:48 UT; red: spectrum at 2:58 UT (flare onset); black: spectrum at 3:05 UT. The additional flux in the black spectrum (best seen at about 6557 and 6570 Å) is caused by the broad line component.
Current usage metrics show cumulative count of Article Views (full-text article views including HTML views, PDF and ePub downloads, according to the available data) and Abstracts Views on Vision4Press platform.
Data correspond to usage on the plateform after 2015. The current usage metrics is available 48-96 hours after online publication and is updated daily on week days.
Initial download of the metrics may take a while.