Fig. 6
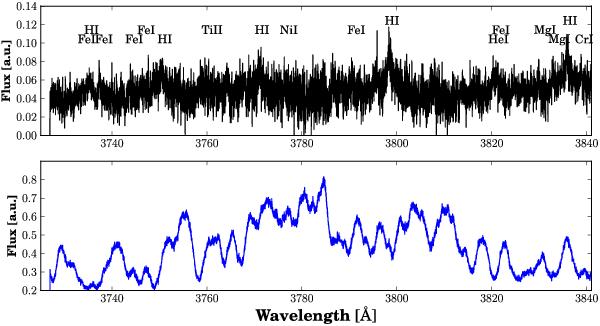
Flare onset spectrum of AB Dor A in an arbitrary chosen wavelength range covering the blue end of our observations including the Balmer lines H9–H13. Top: the flare spectrum with a quiescent spectrum subtracted. The identified emission lines are labelled. Bottom: the original flare spectrum.
Current usage metrics show cumulative count of Article Views (full-text article views including HTML views, PDF and ePub downloads, according to the available data) and Abstracts Views on Vision4Press platform.
Data correspond to usage on the plateform after 2015. The current usage metrics is available 48-96 hours after online publication and is updated daily on week days.
Initial download of the metrics may take a while.