Free Access
Fig. 14
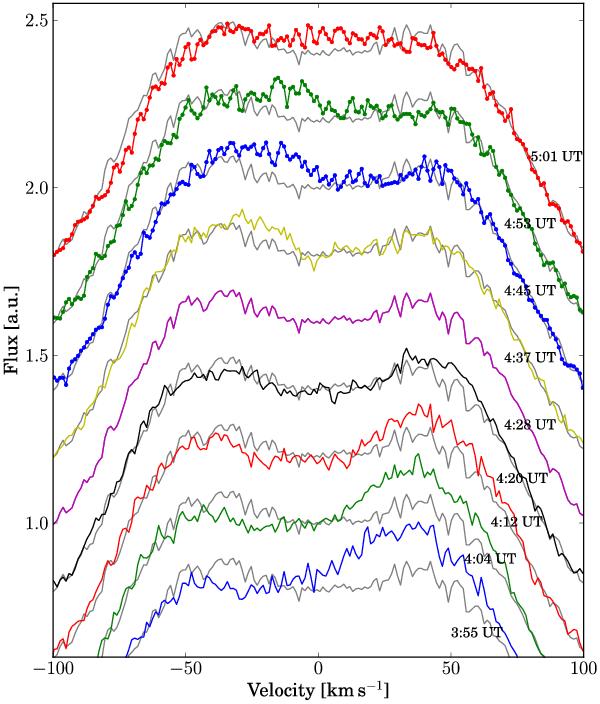
Central part of the Ca ii K emission line for different times. The spectra are offset for convenience, and a PHOENIX spectrum has been subtracted. The spectrum taken at 4:28 UT is always over-plotted for better comparison.
Current usage metrics show cumulative count of Article Views (full-text article views including HTML views, PDF and ePub downloads, according to the available data) and Abstracts Views on Vision4Press platform.
Data correspond to usage on the plateform after 2015. The current usage metrics is available 48-96 hours after online publication and is updated daily on week days.
Initial download of the metrics may take a while.