Free Access
Fig. 13
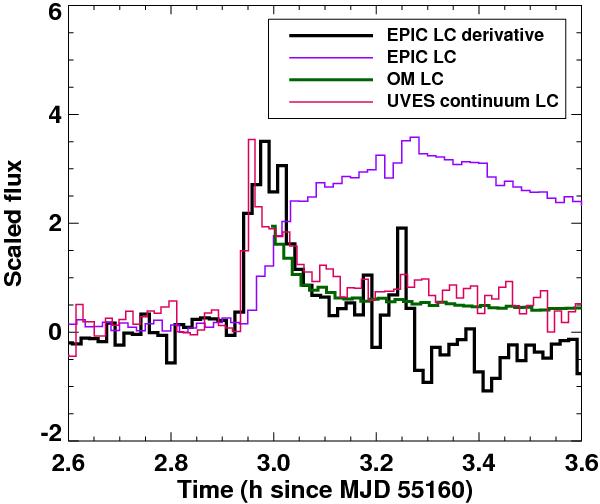
Neupert effect observed during the large flare on AB Dor A. Depicted are the combined EPIC X-ray light curve in violet, its time derivative (smoothed by five bins) in black, the OM light curve in green, and the UVES continuum light curve in red.
Current usage metrics show cumulative count of Article Views (full-text article views including HTML views, PDF and ePub downloads, according to the available data) and Abstracts Views on Vision4Press platform.
Data correspond to usage on the plateform after 2015. The current usage metrics is available 48-96 hours after online publication and is updated daily on week days.
Initial download of the metrics may take a while.