Fig. 12
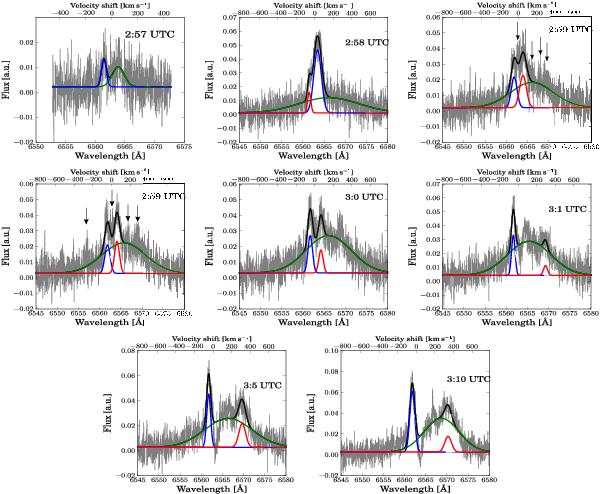
Fit examples of the Hα line with the observed quiescent spectrum subtracted. The data is shown in grey, the fit components are shown in green, blue, and red, and the resulting fit is shown in black. The data contains additional narrow short-lived line components, which are not fitted here, but are indicated by arrows for the two most complicated spectra at 3:59 UT. Between 3:00 and 3:01 UT the fit switches to another line component. The second spectrum in the upper row shows the flare onset. In the last two spectra one can note an absorption line at about 6563 Å, which is caused by the dimming of a preflare line component and not caused by the flare.
Current usage metrics show cumulative count of Article Views (full-text article views including HTML views, PDF and ePub downloads, according to the available data) and Abstracts Views on Vision4Press platform.
Data correspond to usage on the plateform after 2015. The current usage metrics is available 48-96 hours after online publication and is updated daily on week days.
Initial download of the metrics may take a while.