Fig. 11
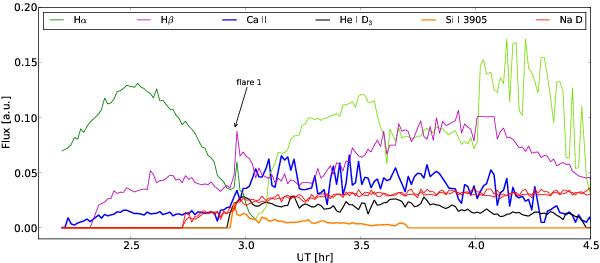
Amplitude of the Gaussian fit for the strongest chromospheric emission lines. In case of multiple line components, the strongest narrow fitting component is shown (Hα, Hβ, Ca ii K). The time interval covers the first 2.3 h of observations, including the flare onset at 2:58 UT. For fitting Hα, a PHOENIX spectrum has been subtracted; the change of the green hue indicates that the fit switched to another line component (see text). Colours are indicated in the legend; both Na i D lines are denoted in red.
Current usage metrics show cumulative count of Article Views (full-text article views including HTML views, PDF and ePub downloads, according to the available data) and Abstracts Views on Vision4Press platform.
Data correspond to usage on the plateform after 2015. The current usage metrics is available 48-96 hours after online publication and is updated daily on week days.
Initial download of the metrics may take a while.