Fig. 10
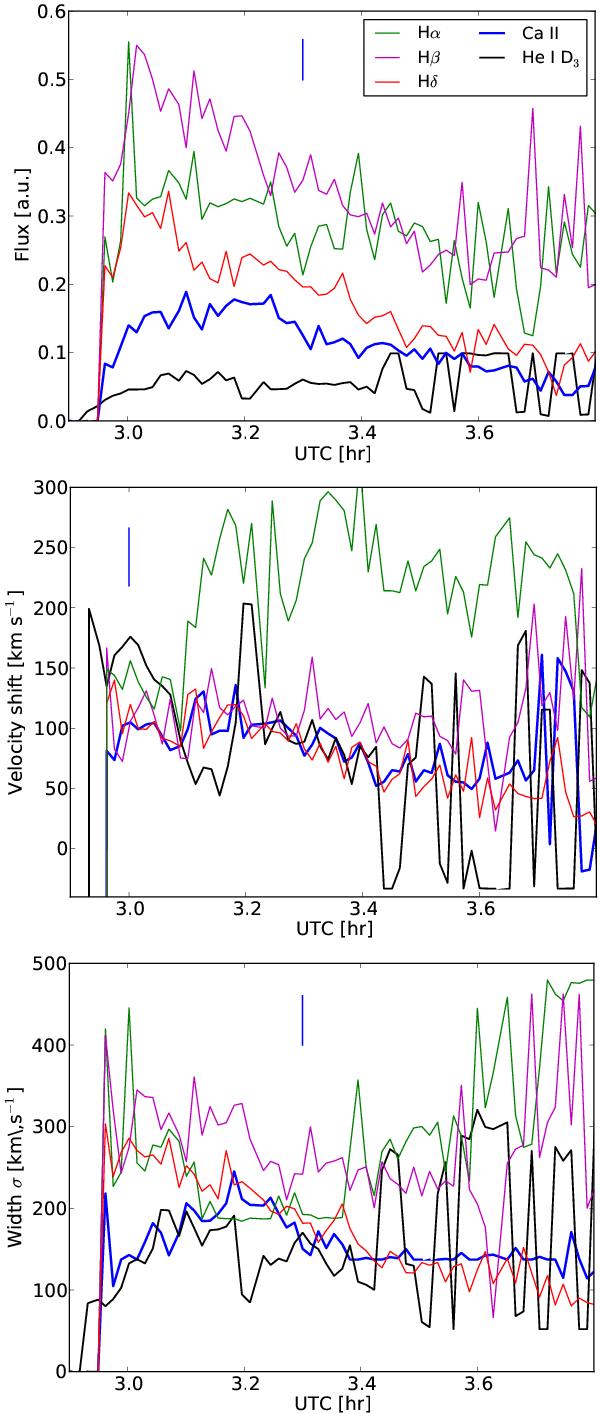
Characteristics of the broad line component: Top: flux amplitude; Middle: velocity shift of the line centre; Bottom: Gaussian width in km s-1. The legend applies to all panels. The earlier rise in the He i D3 line is caused by using a running mean for the fitting process. The high velocity shifts in Hα are caused by line subcomponents influencing the fit. The vertical bar in each panel represents a typical error bar.
Current usage metrics show cumulative count of Article Views (full-text article views including HTML views, PDF and ePub downloads, according to the available data) and Abstracts Views on Vision4Press platform.
Data correspond to usage on the plateform after 2015. The current usage metrics is available 48-96 hours after online publication and is updated daily on week days.
Initial download of the metrics may take a while.