Fig. 1
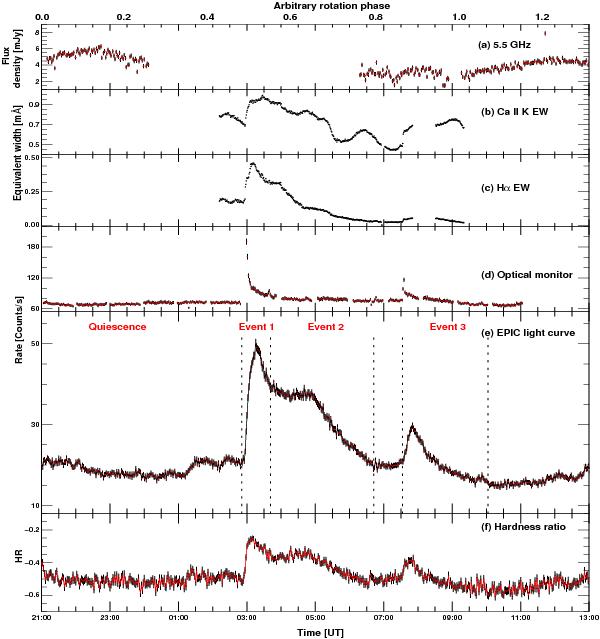
Light curves of AB Dor A observed on 25 Nov. 2009: a) 5.5 GHz radio flux from ATCA observations binned to 120 s; b) and c) Ca ii K flux and Hα equivalent widths calculated from UVES spectra; d) OM light curve; e) EPIC (combined MOS and pn) light curve; f) EPIC hardness ratio. Light curves d) to f) are binned to 100 s. The vertical lines in panel e) indicate the time segment corresponding to the events discussed in the article. Plotted at the top is the arbitrary rotation phase.
Current usage metrics show cumulative count of Article Views (full-text article views including HTML views, PDF and ePub downloads, according to the available data) and Abstracts Views on Vision4Press platform.
Data correspond to usage on the plateform after 2015. The current usage metrics is available 48-96 hours after online publication and is updated daily on week days.
Initial download of the metrics may take a while.