Fig. 4
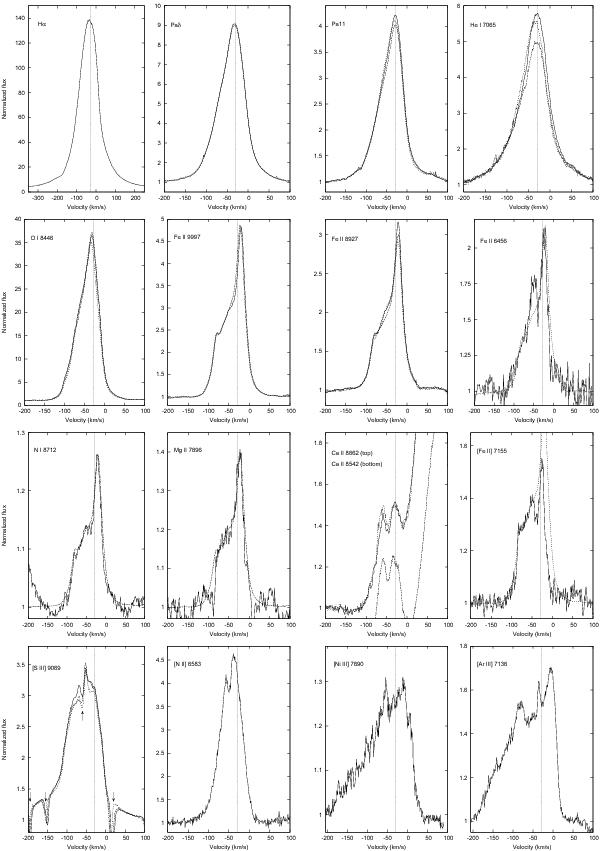
Strong permitted and forbidden emission lines in the spectrum of Wd1-9. Note that the Hα (top left) has a different velocity scale to the remaining lines. In panels where multiple spectra are overplotted, solid line =6/4/2011, dashed line =14/4/2011 and dotted line =25/4/2011 respectively. For N iλ8712, Mg iiλ7896, Fe iiλ6456 and [Fe ii] λ7155 a scaled Fe iiλ9997 line is overplotted for comparison, and in all panels the vertical line marks the radial velocity derived from the Pa9...16 lines. Arrows mark telluric features overlapping the [S iii] line.
Current usage metrics show cumulative count of Article Views (full-text article views including HTML views, PDF and ePub downloads, according to the available data) and Abstracts Views on Vision4Press platform.
Data correspond to usage on the plateform after 2015. The current usage metrics is available 48-96 hours after online publication and is updated daily on week days.
Initial download of the metrics may take a while.