Free Access
Fig. 1
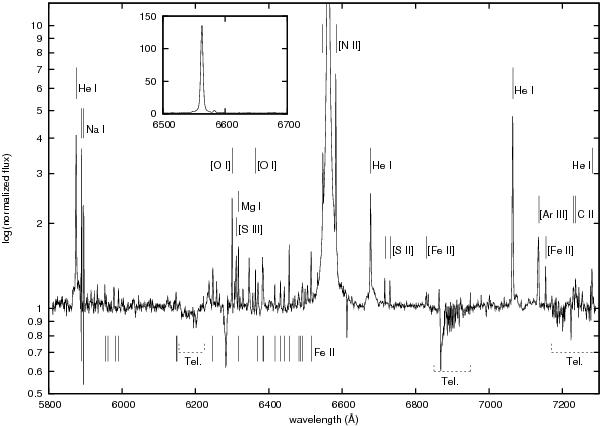
Semi-logarithmic VLT/FORS2 spectrum from 2004 covering 5800–7300 Å. Rest wavelengths of the principal emission lines are indicated, and telluric bands are also identified. The low-resolution inset shows a linear plot of the 6500–6700 Å region to highlight the strength of the Hα emission.
Current usage metrics show cumulative count of Article Views (full-text article views including HTML views, PDF and ePub downloads, according to the available data) and Abstracts Views on Vision4Press platform.
Data correspond to usage on the plateform after 2015. The current usage metrics is available 48-96 hours after online publication and is updated daily on week days.
Initial download of the metrics may take a while.