Free Access
Fig. 5
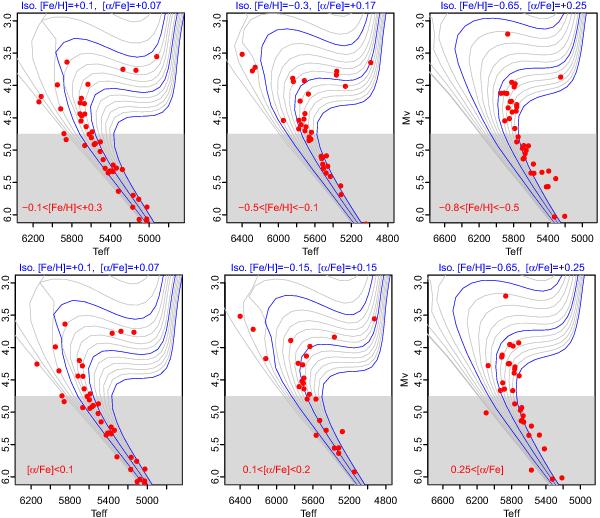
HR diagrams for stars selected in the thick disk sequence for various ranges in metallicity. The exact range in [Fe/H] is indicated in the legend in the bottom left corner of each plot. The isochrones are the same as in Fig. 4. Stars that have been dated are above the grey area.
This figure is made of several images, please see below:
Current usage metrics show cumulative count of Article Views (full-text article views including HTML views, PDF and ePub downloads, according to the available data) and Abstracts Views on Vision4Press platform.
Data correspond to usage on the plateform after 2015. The current usage metrics is available 48-96 hours after online publication and is updated daily on week days.
Initial download of the metrics may take a while.