Fig. 4
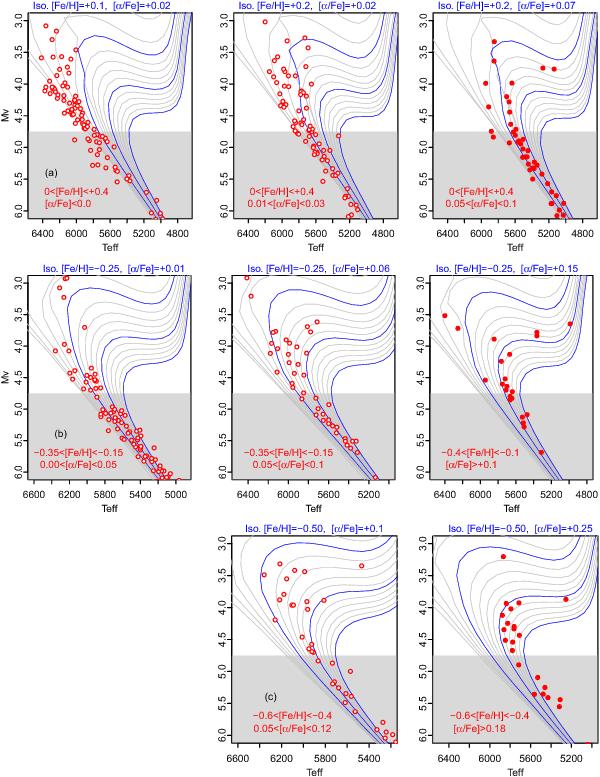
HR diagrams for stars in various metallicity ranges and [α/Fe] content (given explicitly in the legend at the bottom left corner of each plot). The lines in each plot are isochrones of various ages (Demarque et al. 2004). Isochrones shown as solid dark blue lines have ages of 5, 10 and 15 Gyr (from left to right). The open and solid red circles are the same as defined in Fig. 1. Stars that have been dated are above the grey area.
Current usage metrics show cumulative count of Article Views (full-text article views including HTML views, PDF and ePub downloads, according to the available data) and Abstracts Views on Vision4Press platform.
Data correspond to usage on the plateform after 2015. The current usage metrics is available 48-96 hours after online publication and is updated daily on week days.
Initial download of the metrics may take a while.