Fig. 2
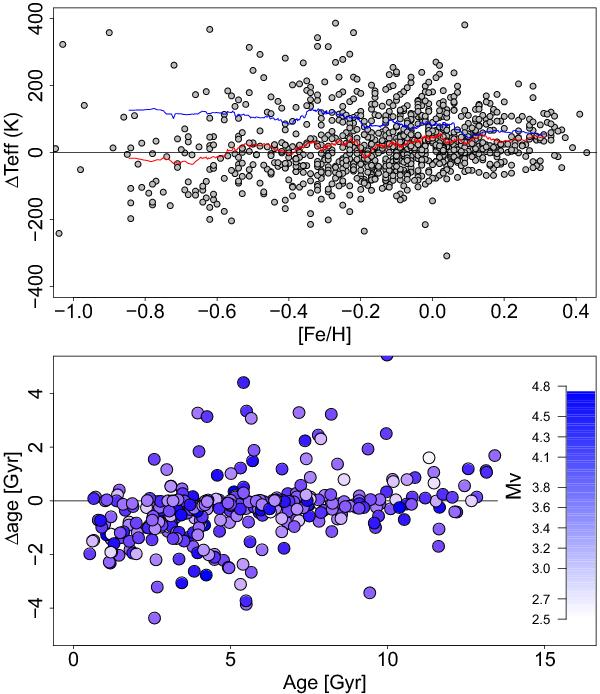
Upper plot: difference between effective temperatures from Adibekyan et al. (2012) and those derived from the V − K indices and calibration from Casagrande et al. (2010) for the whole sample. The lower curve is the mean of the difference calculated over 75 points, the upper curve is the dispersion. Lower plot: difference in age resulting from the two scales, as a function of age (based on Adibekyan et al. (2012) spectroscopic scale) for stars with “good” ages (see text).
Current usage metrics show cumulative count of Article Views (full-text article views including HTML views, PDF and ePub downloads, according to the available data) and Abstracts Views on Vision4Press platform.
Data correspond to usage on the plateform after 2015. The current usage metrics is available 48-96 hours after online publication and is updated daily on week days.
Initial download of the metrics may take a while.