Free Access
Fig. 17
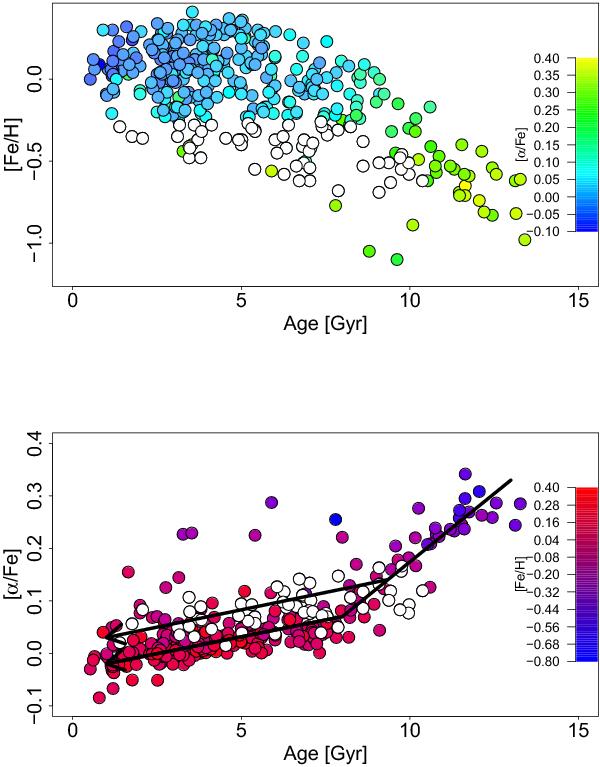
Age–metallicity and age–[α/Fe] distributions, with stars in the metal-poor tail of the thin disk sequence (see Fig. 1) at [Fe/H] < −0.3 dex shown as white dots. The metal-poor thin disk stars draw a sequence parallel to the local thin disk, joining the thick disk at 9−10 Gyr and [α/Fe] in [0.1,0.15].
Current usage metrics show cumulative count of Article Views (full-text article views including HTML views, PDF and ePub downloads, according to the available data) and Abstracts Views on Vision4Press platform.
Data correspond to usage on the plateform after 2015. The current usage metrics is available 48-96 hours after online publication and is updated daily on week days.
Initial download of the metrics may take a while.