Fig. 16
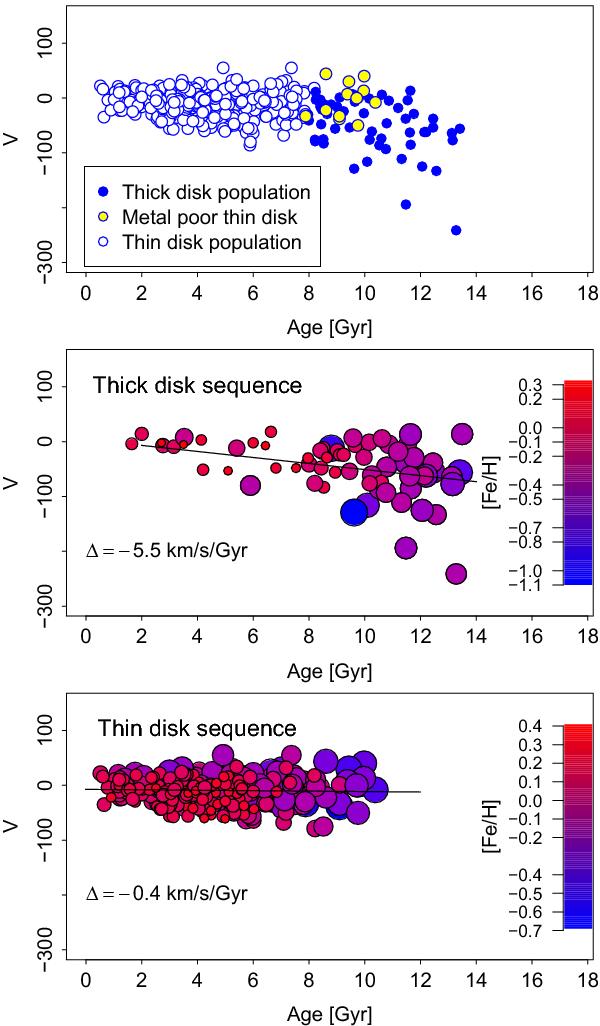
Top panel: V component of the velocity as a function of age for thick and thin disks population stars, as defined in Fig. 6. Middle panel: V component of the velocity as a function of age for thick disk sequence stars. Bottom panel: V component of the velocity as a function of age for thin disk sequence stars. In all panels, the color and the size of the symbols are a function of the star’s [Fe/H] value as indicated by the color bar in each plot. Solid lines represent the best fit linear regression to the data. For the thick disk sequence, only stars in prograde orbits (V > −220 km s-1) have been included in the fit. For thin disk sequence stars, the two points with V < −200 km s-1 have not been included when evaluating the best fit linear regression of the data.
Current usage metrics show cumulative count of Article Views (full-text article views including HTML views, PDF and ePub downloads, according to the available data) and Abstracts Views on Vision4Press platform.
Data correspond to usage on the plateform after 2015. The current usage metrics is available 48-96 hours after online publication and is updated daily on week days.
Initial download of the metrics may take a while.