Fig. 13
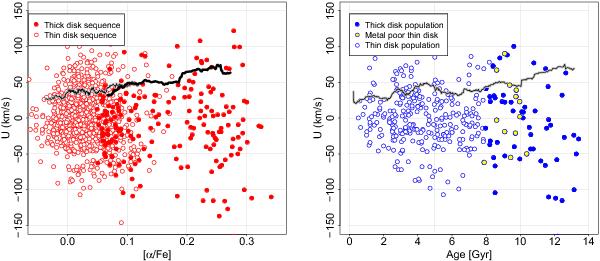
Left panel: U component of velocity as a function of [α/Fe] for the stars in the sample (open red circles represent stars on the thin disk sequence; solid red circles represent stars on the thick disk sequence). The two thin and thick curves are running dispersions for U component of the velocity of the thin and thick disk sequence stars, calculated as a function of [α/Fe] (over 50 stars). Right panel: U component of velocity as a function of age. Open blue circles represent thin disk stars and solid blue circles represent thick disk stars as defined in Fig. 5.
Current usage metrics show cumulative count of Article Views (full-text article views including HTML views, PDF and ePub downloads, according to the available data) and Abstracts Views on Vision4Press platform.
Data correspond to usage on the plateform after 2015. The current usage metrics is available 48-96 hours after online publication and is updated daily on week days.
Initial download of the metrics may take a while.