Fig. 4
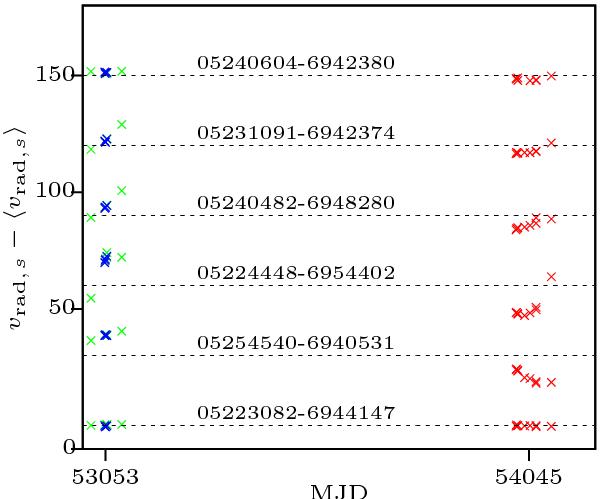
Radial velocity curves for six stars. The relative radial velocities vrad,s − ⟨vrad,s⟩ determined for each exposure are plotted as a function of MJD for five stars where the T-test failed and we suspect a variability in the radial velocity. The curves were shifted for legibility (the dashed line represents the offset). The bottom curve (star 05223082-6944147) is a star with no radial velocity variability and shown here for reference. In red: HR11, in green: HR13, in blue: HR14 (for HR13 data and HR14 data obtained at the same epoch, the green crosses are below the blue ones). Error bars are smaller than the symbols (≤ 1 km s-1).
Current usage metrics show cumulative count of Article Views (full-text article views including HTML views, PDF and ePub downloads, according to the available data) and Abstracts Views on Vision4Press platform.
Data correspond to usage on the plateform after 2015. The current usage metrics is available 48-96 hours after online publication and is updated daily on week days.
Initial download of the metrics may take a while.