Fig. 3
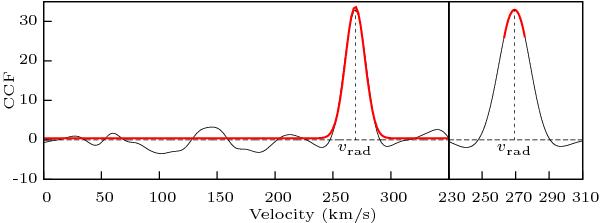
Left panel: example of cross-correlation function (black line) and its Gaussian fit (red thick line). Right panel: zoom in on the maximum of the cross-correlation function and its parabolic fit (red thick line). We first used a Gaussian fit to locate the position of the maximum and then defined a smaller velocity range (Gaussian fit FWHM) and computed the cross-correlation function over a finer grid to improve the determination of the radial velocity.
Current usage metrics show cumulative count of Article Views (full-text article views including HTML views, PDF and ePub downloads, according to the available data) and Abstracts Views on Vision4Press platform.
Data correspond to usage on the plateform after 2015. The current usage metrics is available 48-96 hours after online publication and is updated daily on week days.
Initial download of the metrics may take a while.