Fig. 1
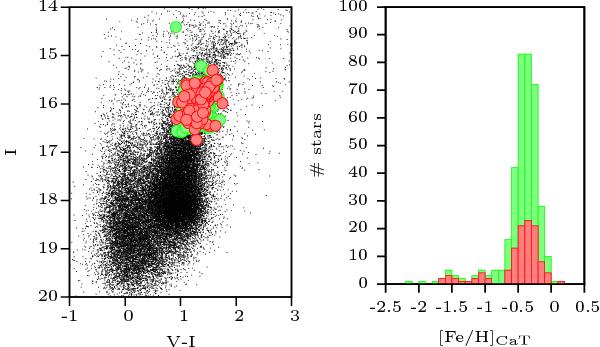
Colour–magnitude diagram (left panel) and metallicity distribution (right panel) of Cole et al. (2005) RGB sample (green) and our selected RGB stars (red). V and I magnitudes are from the OGLE catalogue Udalski et al. (1997, 2000); Szymanski (2005) for the samples of Cole et al. (2005) and the present paper, while black dots in the CMD are photometric data from Zaritsky et al. (2004) catalogue. Metallicities in the right panel are those derived from the infrared Ca ii triplet index by Cole et al. (2005).
Current usage metrics show cumulative count of Article Views (full-text article views including HTML views, PDF and ePub downloads, according to the available data) and Abstracts Views on Vision4Press platform.
Data correspond to usage on the plateform after 2015. The current usage metrics is available 48-96 hours after online publication and is updated daily on week days.
Initial download of the metrics may take a while.