Fig. 12
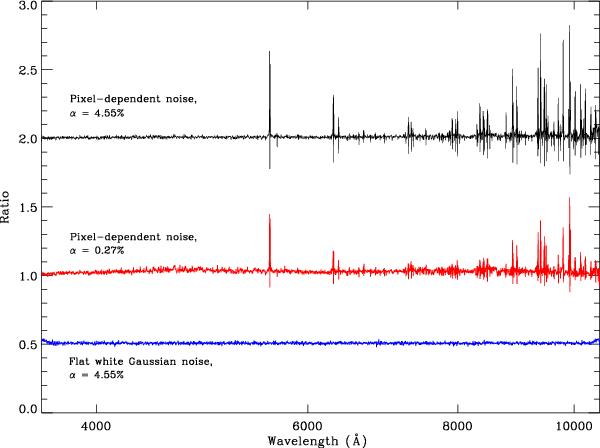
Ratio of the true error-curve with respect to the derived error-curve from the rms error per pixel on the difference between the original input spectrum and the denoised spectrum for both flat noise and pixel-dependent noise. The lower curve (blue) has been shifted down (by 0.5) for clarity, and the upper curve (black), has also been shifted up (by 1.0) for clarity. Note the minor systematic edge effects on the denoising of white-Gaussian (flat) noise. Clearly the complex noise region has a marked systematic effect on the denoising, with rapidly changing noise regions experiencing both over- and under-estimates in the noise strength. This systematic effect is dependent upon the FDR threshold chosen, with thresholding that is less strict (upper curve) being more prone than stricter thresholding (middle curve).
Current usage metrics show cumulative count of Article Views (full-text article views including HTML views, PDF and ePub downloads, according to the available data) and Abstracts Views on Vision4Press platform.
Data correspond to usage on the plateform after 2015. The current usage metrics is available 48-96 hours after online publication and is updated daily on week days.
Initial download of the metrics may take a while.