Free Access
Fig. 9
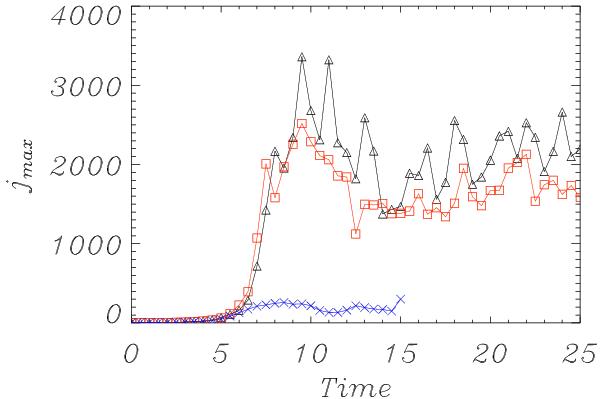
Maximum current magnitude is shown as a function of time for the driver 1 experiments with a 5123 grid for η = 0 (black, triangles), η = 10-5 (red, squares), and η = 10-4 (blue, crosses). The symbols correspond to the times at which the current is actually recorded in each experiment.
Current usage metrics show cumulative count of Article Views (full-text article views including HTML views, PDF and ePub downloads, according to the available data) and Abstracts Views on Vision4Press platform.
Data correspond to usage on the plateform after 2015. The current usage metrics is available 48-96 hours after online publication and is updated daily on week days.
Initial download of the metrics may take a while.